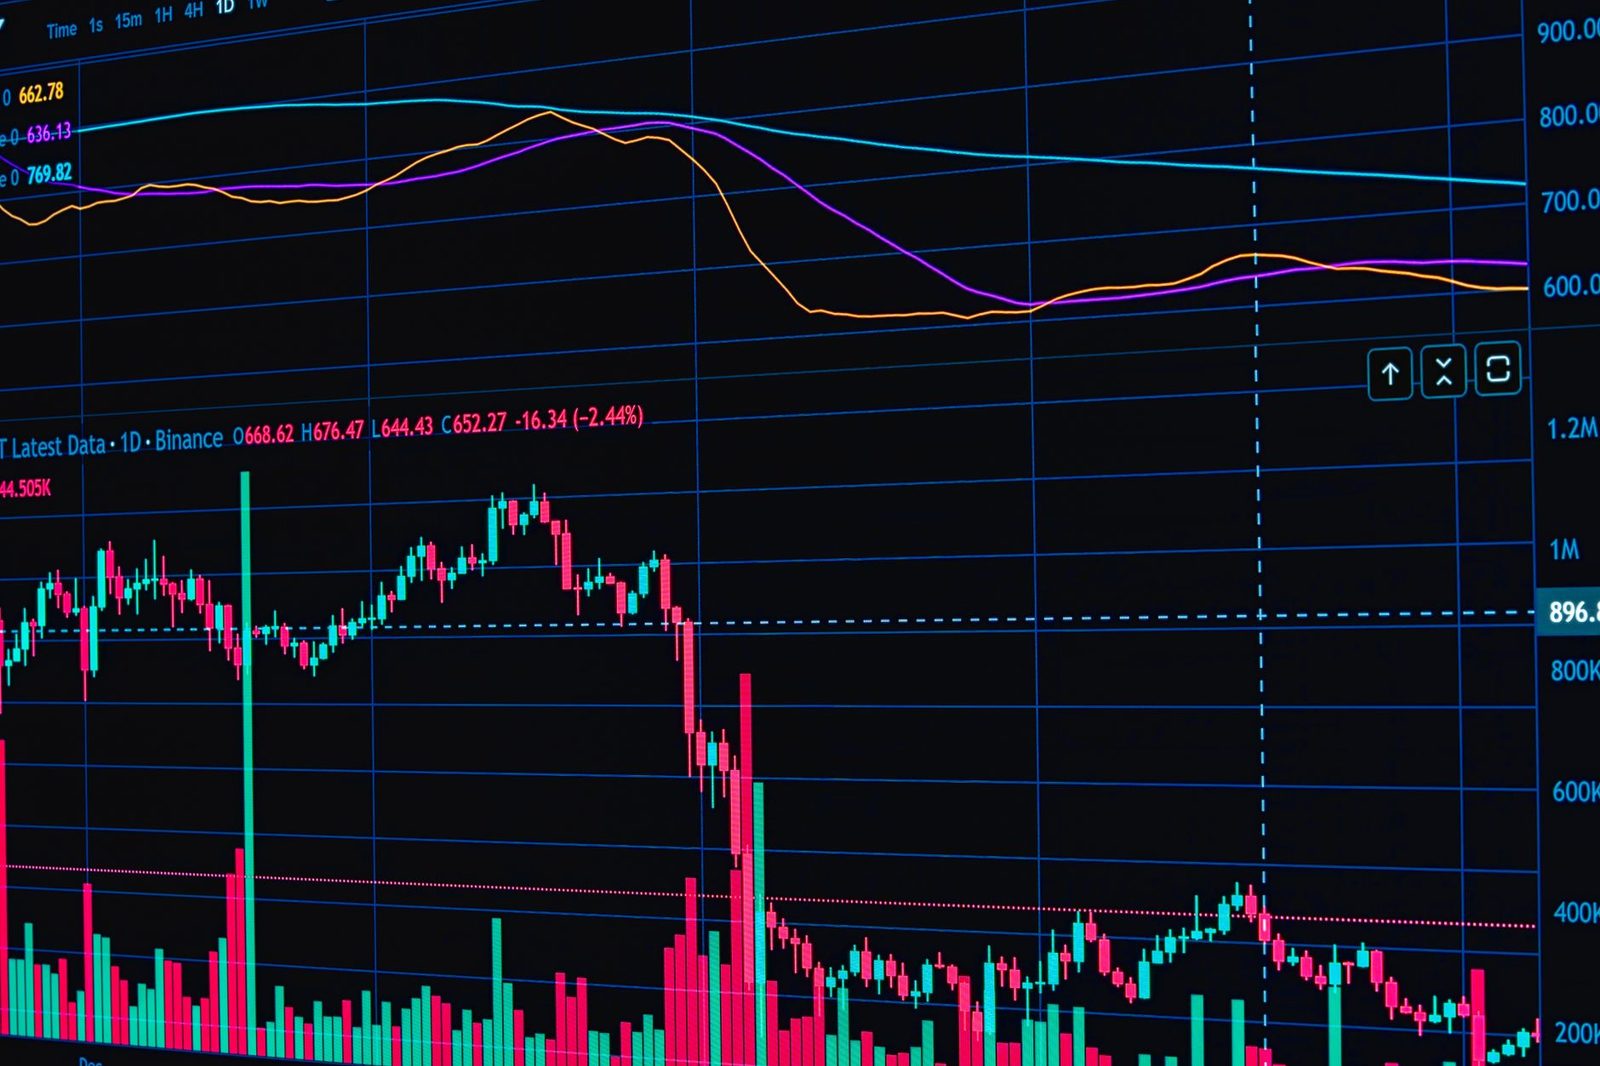
Options desks call it the fear gauge for a reason. When markets stay calm, premiums shrink and traders get bored. Then a single earnings miss or rate decision flips the mood in hours. Volatility forecasting tries to see that flip before it happens. Artificial intelligence has become the tool many risk teams now use to spot it.
The pitch is simple. Feed a model years of price swings, trading volume, and news flow. Ask it to flag when calm is about to end. The harder part is separating real warning signs from noise. Markets throw off a lot of noise. Most days look like most other days, until they do not.
This piece looks at how AI-driven volatility forecasting actually works. It also covers where it tends to help, and where it still falls short. The goal is a clear-eyed view, not a sales pitch for prediction machines.
What Volatility Forecasting Actually Predicts
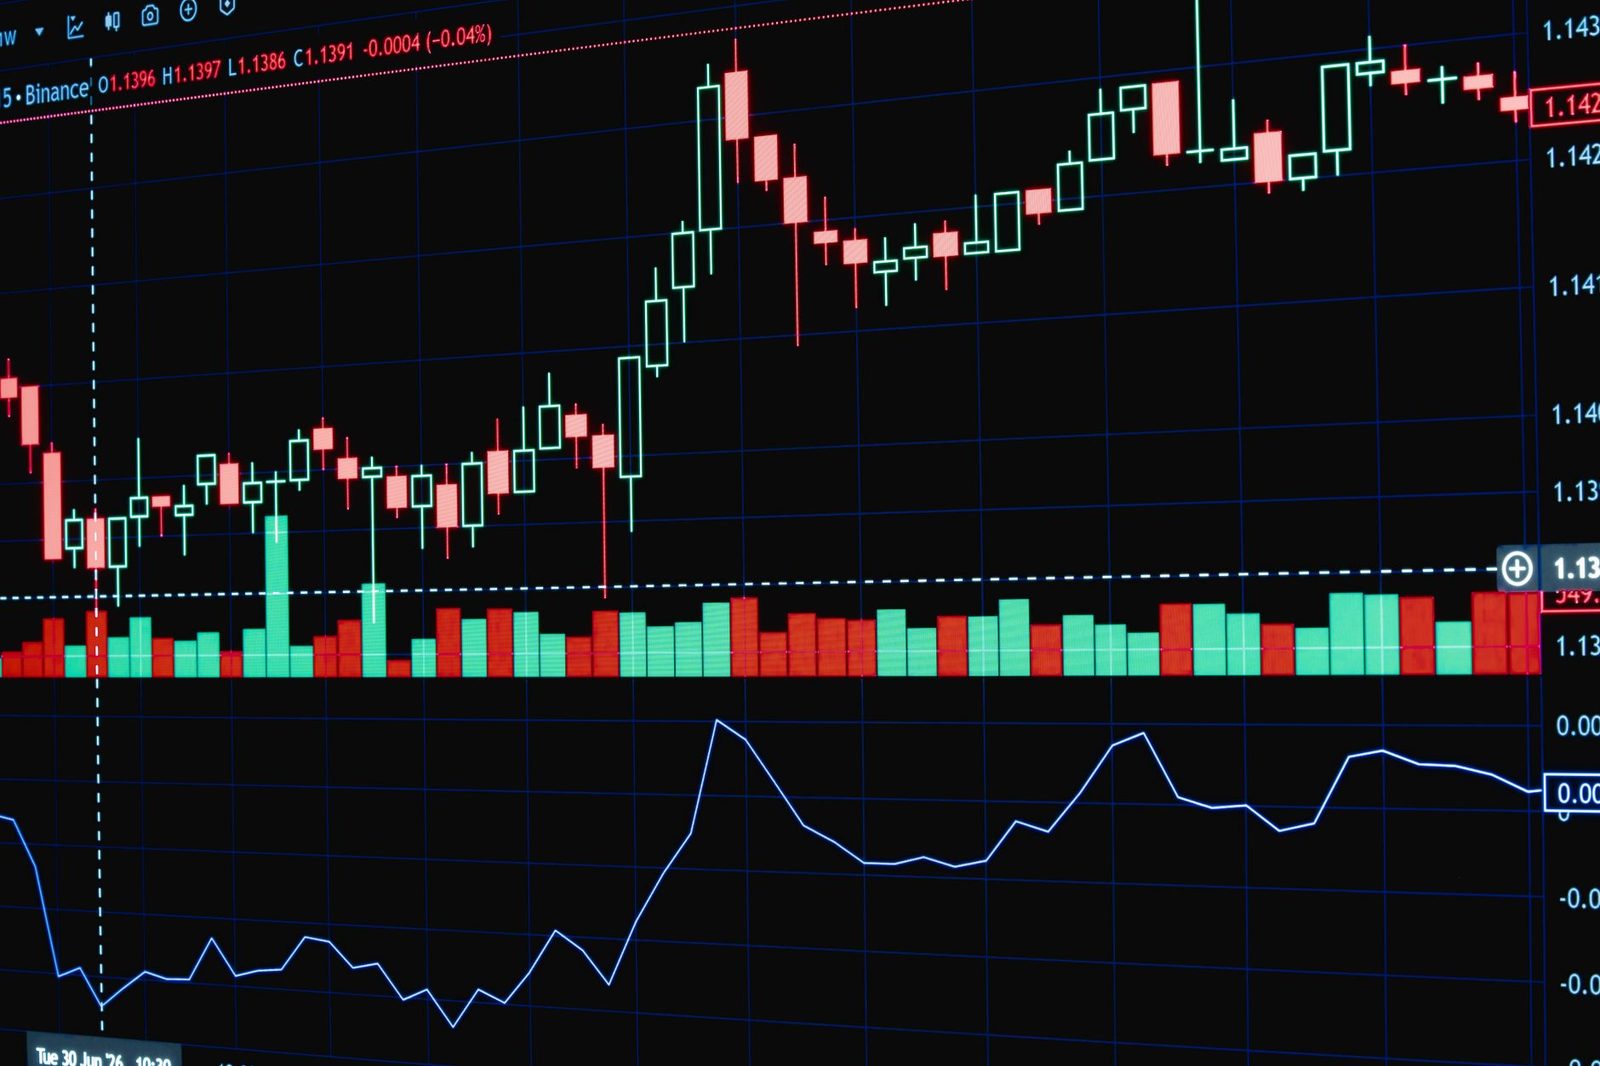
Volatility is not a price direction. It is a measure of how much prices move, in either direction, over a set stretch of time. A stock can be volatile while going up. It can be volatile while going down too. Forecasting volatility means guessing the size of future price swings, not their direction.
This distinction matters most for options traders. Option prices are built on expected volatility, not on where anyone thinks a stock will land. A trader who gets the direction right but misjudges volatility can still lose money on the trade. Risk managers care about volatility for a different reason. It drives how much capital a firm must hold against its positions. The SEC's investor glossary is a useful starting point for anyone who wants the plain definitions behind these terms.
Traditional volatility forecasting leaned on statistical models. These models looked at how much a price had swung recently. They then assumed the near future would look much like the recent past. That works fine in quiet markets. It breaks down fast when something new hits the tape.
How AI Reads Market Signals Differently
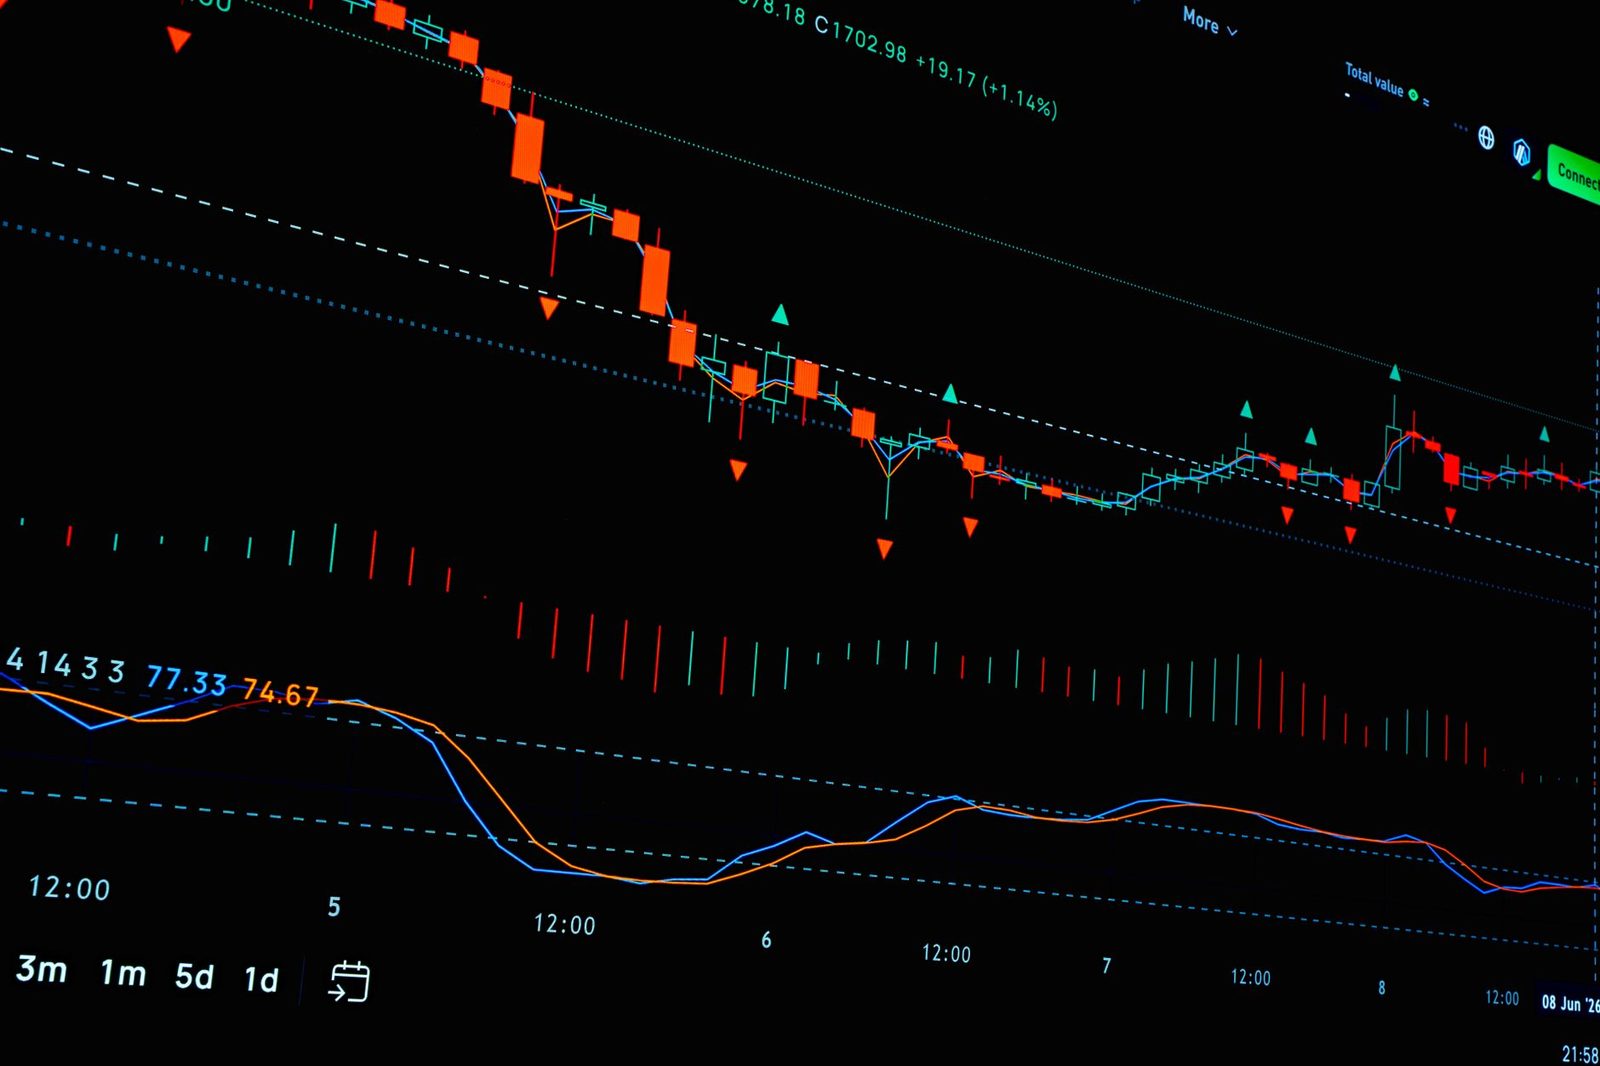
AI-based volatility forecasting adds two things older models lacked. It can process many data sources at once. And it can update its view in real time, not just once a day.
A typical setup pulls in price history, trading volume, options positioning, and sometimes news text or social media chatter. The model looks for patterns that came before past volatility spikes. Thin trading before a big move. Unusual options buying. Certain kinds of headlines clustering together. None of these signals guarantee a spike is coming. Together, they can shift the odds.
Machine learning models are also good at spotting regime shifts. That is a shift from a calm market pattern to a turbulent one, or back again. Instead of assuming the future looks like the recent past, the model tries to guess which regime the market is entering. This is closely related to the pattern-matching work covered in machine learning models for stock price prediction, though volatility forecasting asks a different question. It cares about the size of moves, not their direction.
It is worth being honest about the limits here too. These models are trained on history. A genuinely new kind of shock, one the model has never seen a version of before, can still catch it off guard. That is not a flaw unique to AI. It is a flaw in forecasting itself.
Where the Models Help and Where They Miss
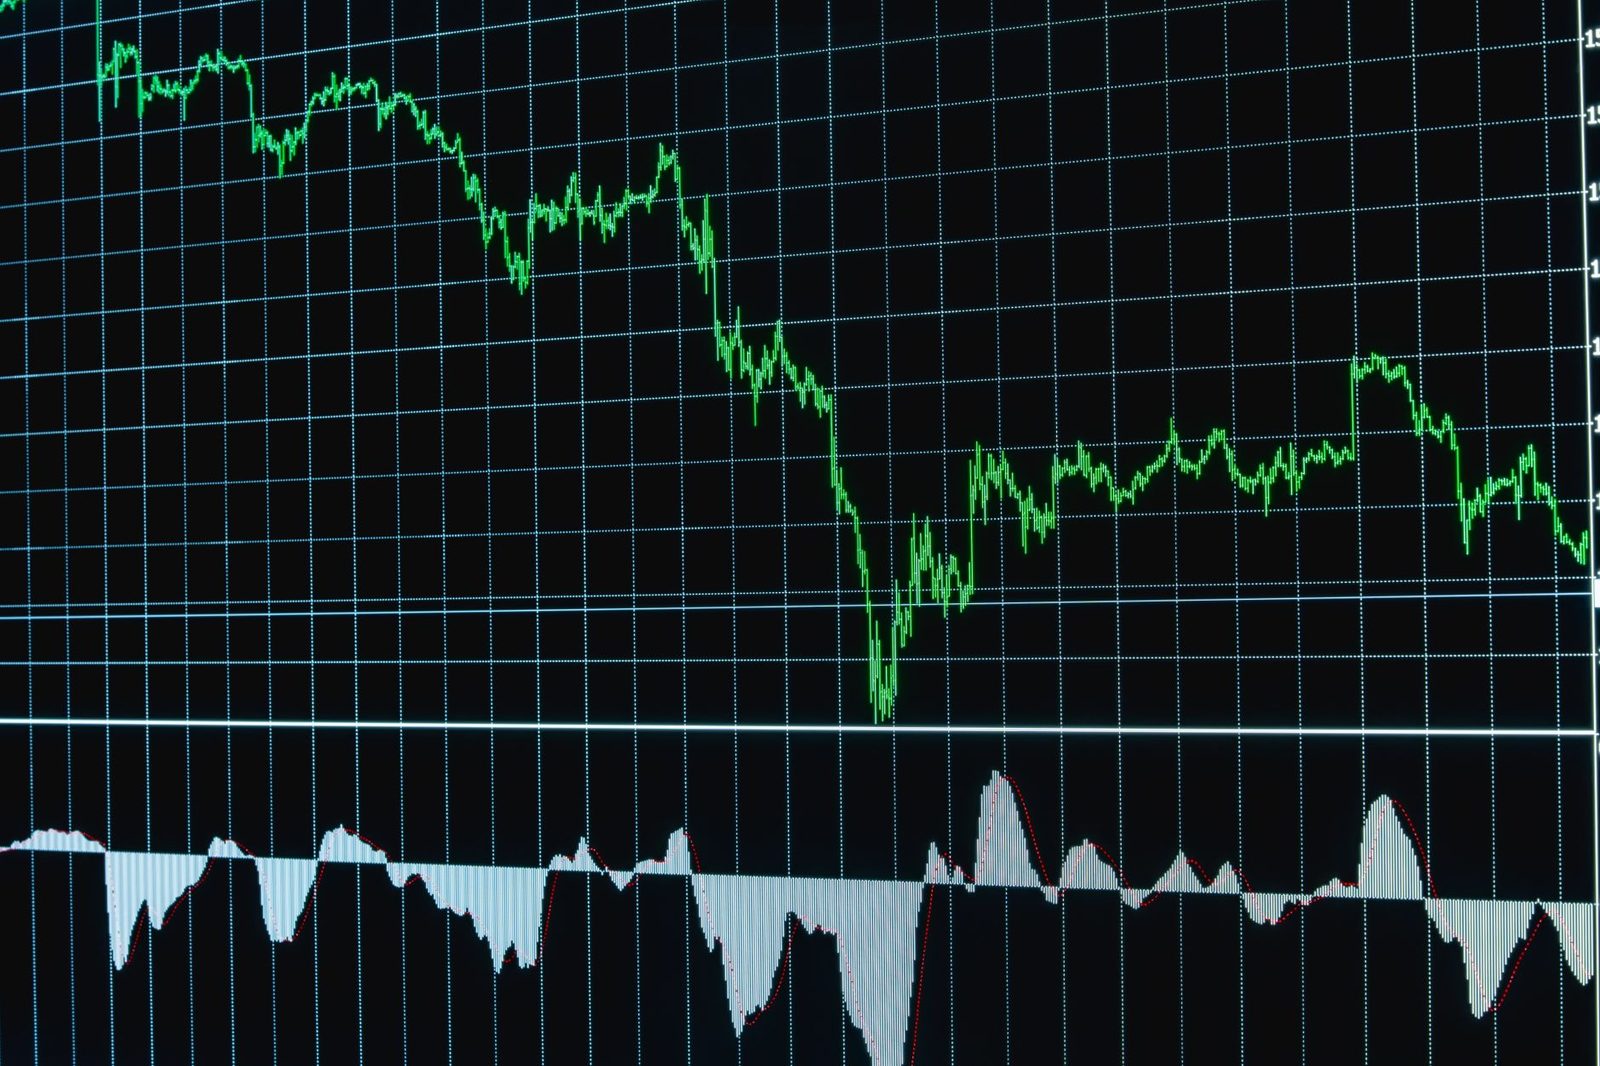
The clearest strength of AI-driven volatility forecasting shows up in calm-to-turbulent transitions. These are moments when quiet markets start to wobble. Human traders often notice the shift only after it is obvious. Well-tuned models can pick up subtle changes in trading patterns days earlier. That earlier signal gives risk managers more time to adjust positions before the wobble becomes a full swing.
The weak spot is sudden, sourceless shocks. A shock event, meaning a surprise most of the market did not see coming, is exactly what breaks pattern-based forecasting. If a shock has no real precedent in the training data, the model has nothing useful to draw on. It may look confident anyway, which is arguably worse than admitting it does not know.
There is also a subtler problem. As more firms use similar AI approaches, their models start reacting to the same signals at the same time. That can make markets move together more than they would otherwise. A tool built to forecast turbulence can end up adding a little turbulence of its own. Anyone reading commentary on this from bodies like the Commodity Futures Trading Commission will see this concern raised often around automated trading generally, not just volatility tools specifically.
None of this means the models are useless. It means they work best as one input among several, not as a single source of truth.
Practical Steps for Traders and Risk Managers
What this means in practice is a shift in how volatility forecasts get used. Fewer teams treat a single model output as gospel. More teams treat it as one voice in a small committee of signals.
- Traders should treat an AI volatility forecast as one input, not the final answer, and always check it against simpler measures like recent price ranges.
- Risk managers should ask how a model performed during past shocks, not just during calm periods, since calm-period accuracy hides very little skill.
- Options traders should watch for forecasts that disagree sharply with current option prices, since that gap can flag either a mispriced option or a model that is drifting off track.
- Anyone using these tools should build in a manual override, so a human can step in when a forecast looks confident but the underlying data looks thin.
- Teams should retrain or recheck models on a regular schedule, since market patterns shift over time and an old model can quietly go stale.
Our analysis suggests the biggest practical gain is not in catching every spike. It is in shortening the time between the first warning sign and a portfolio adjustment. Even a few hours of extra warning can matter a great deal during a sharp turn in the market. That is the real value of volatility forecasting: not certainty, but a slightly earlier nudge.
Conclusion
Volatility forecasting with AI is not a crystal ball. It is a pattern-reading tool that gets better at spotting the early edges of turbulence, and stays weak at predicting the truly new kind of shock. For options traders and risk managers, that is still a real edge. The honest way to use it is as one signal among several, checked often, and never trusted blindly.
For more context, read Trace any viral photo to its real source.
For more context, read Trace a viral photo's origin with reverse image search.
For more context, read Car: Guide and Advanced.