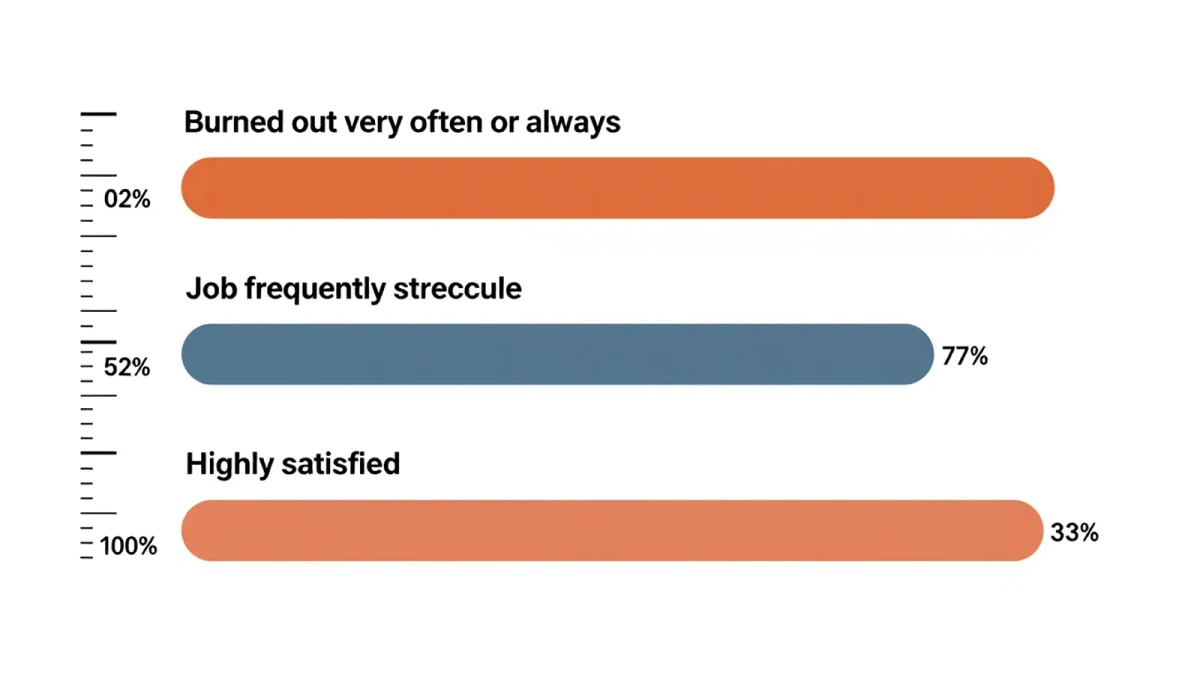
When a 2022 Gallup poll found 52 percent of K-12 teachers reporting burnout very often or always, the highest rate of any U.S. industry, the number traveled far beyond education circles. It also started an argument that never quite resolved: is burnout the same thing as morale? The surveys districts, unions and media rely on each measure a different slice of the teacher experience, and reading them as interchangeable produces bad policy.
What is the difference between morale, burnout and satisfaction?
Morale is a mood; burnout is a clinical-adjacent syndrome; satisfaction is an evaluation. Gallup's burnout instrument asks how often respondents feel exhausted, cynical about their work or ineffective at it, a framing drawn from occupational-health research. Job-satisfaction surveys, like the RAND State of the American Teacher series, ask teachers to rate how content they are with the role overall. Morale questions, when researchers ask them directly, tend to capture team spirit and near-term energy.
The distinction matters because the interventions differ. A staff with low satisfaction but low burnout is usually telling you something about pay, workload allocation or respect, all addressable with policy. A staff with high burnout is telling you something about sustained demands outstripping recovery, which a pizza party and a jeans day will not fix, a distinction Gallup's workplace research has made repeatedly.
The headline numbers also move independently. Pew Research Center's 2024 survey of public K-12 teachers found 77 percent describing their job as frequently stressful and 68 percent as overwhelming, yet 33 percent still reported high job satisfaction. People can find the work meaningful and unsustainable at the same time, and most surveys are not built to hold both findings.
Who runs the big surveys, and what are their instruments?
The landscape has four main players. Gallup fields workplace-engagement and burnout items, often with partners such as the Walton Family Foundation, whose 2025 teacher survey linked perceived resources to satisfaction. RAND's State of the American Teacher report, running since 2021, is the academic workhorse, with transparent methodology and salary, well-being and intent-to-leave measures collected in parallel. Pew's 2024 teacher survey, fielded in fall 2023, captured the perception layer: stress, staff shortages and what teachers want the public to know. The National Center for Education Statistics contributes through its School Pulse Panel, which has tracked staffing and climate indicators in public schools since the pandemic.
Then there are the advocacy and vendor surveys, the ones that generate the most alarming percentages. A 2025 We Are Teachers survey of more than 2,400 teachers found roughly 92 percent reporting they had experienced burnout, with about three-quarters calling it severe. That number sounds catastrophic next to Gallup's 52 percent, but the question differs: ever experienced versus very often or always. One asks about memory, the other about Tuesday.
Union surveys sit in between. A National Education Association survey for the 2024-25 school year found 58 percent of Hispanic teachers and 59 percent of Black teachers reporting burnout, a useful equity lens but one collected through a membership audience that skews toward the engaged and the aggrieved.
Why do response rates shape the story?
Teacher surveys increasingly run through email and portal links, and the people who answer them are not a random sample of the profession. A teacher at 7 p.m. on her third unread-parent email of the evening is both more likely to respond and more likely to respond harshly. Researchers weight for this where they can, but weighting cannot conjure respondents who never open the message.
This is why serious trackers matter more than viral one-offs. RAND's parallel collection of well-being and salary data lets analysts separate pay discontent from exhaustion, and NCES School Pulse Panel results come from a designed school sample rather than whoever clicked. When a district wants its own climate read, the methodological floor is anonymity, a third-party collector and consistent items year over year, because the trend line is the finding, not the level.
How should a principal read morale data about their own building?
Building-level data is where survey science goes to die, because samples of 25 teachers cannot be weighted and everyone knows who might have said what. Useful building practice treats annual survey numbers as conversation starters, not verdicts, and pairs them with behavioral proxies that are harder to fake: voluntary-assignment coverage rates, sick-day clustering before breaks, committee volunteering, how many teachers applied for internal leadership roles.
The behavioral signals converge with the national picture. Pew found 30 percent of teachers planning to look for a new job within the year as of 2024, and the Learning Policy Institute estimated in 2025 that roughly one in eight teaching positions nationally was unfilled or filled by an uncertified teacher. Morale surveys did not predict that by asking about feelings; the exit behavior showed up anyway.
What would a better morale measure look like?
The honest version separates three questions into three numbers: how demanding the job is this month, whether people can recover, and whether staff believe leadership acts on feedback. Districts that split these get actionable readings, because low-recovery buildings need schedule and coverage changes, while low-trust buildings need governance changes, and no survey instrument can do both jobs at once.
The next time a headline says teacher morale has crashed, the useful questions are old-fashioned journalism ones: who was asked, how were they selected, what was the exact wording, and what did the same instrument show last year. Nine times out of ten, the story is in those answers rather than the percentage.